
Agricultural Development in Maize and Rice: Yield-Area Dynamics
The diagram divides trends into four quadrants: Top Right (Green): Yield growth and area expansion (intensification with expansion). Top Left (Green): Yield growth and area contraction (intensification with land sparing). Bottom Right (Red): Yield decline/stagnation and area expansion (extensification). Bottom Left (Red): Yield decline and area contraction (contraction).
Four pathways of agricultural change
Agricultural systems grow and evolve in different ways depending on pressures such as population demand, input availability, land resources, and climate conditions. Four key strategies describe these shifts: (1) Intensification – Increasing crop yield per hectare using more or better inputs (e.g., fertilizer, improved seeds, mechanization); (2) Extensification – Expanding the total cultivated area, often into marginal lands or new regions; (3) Concentration – Focusing agricultural production in fewer regions or larger farms to achieve economies of scale, and (4) Contraction – Reducing cultivated area due to land degradation, urbanization, or shifts to other land uses like conservation.
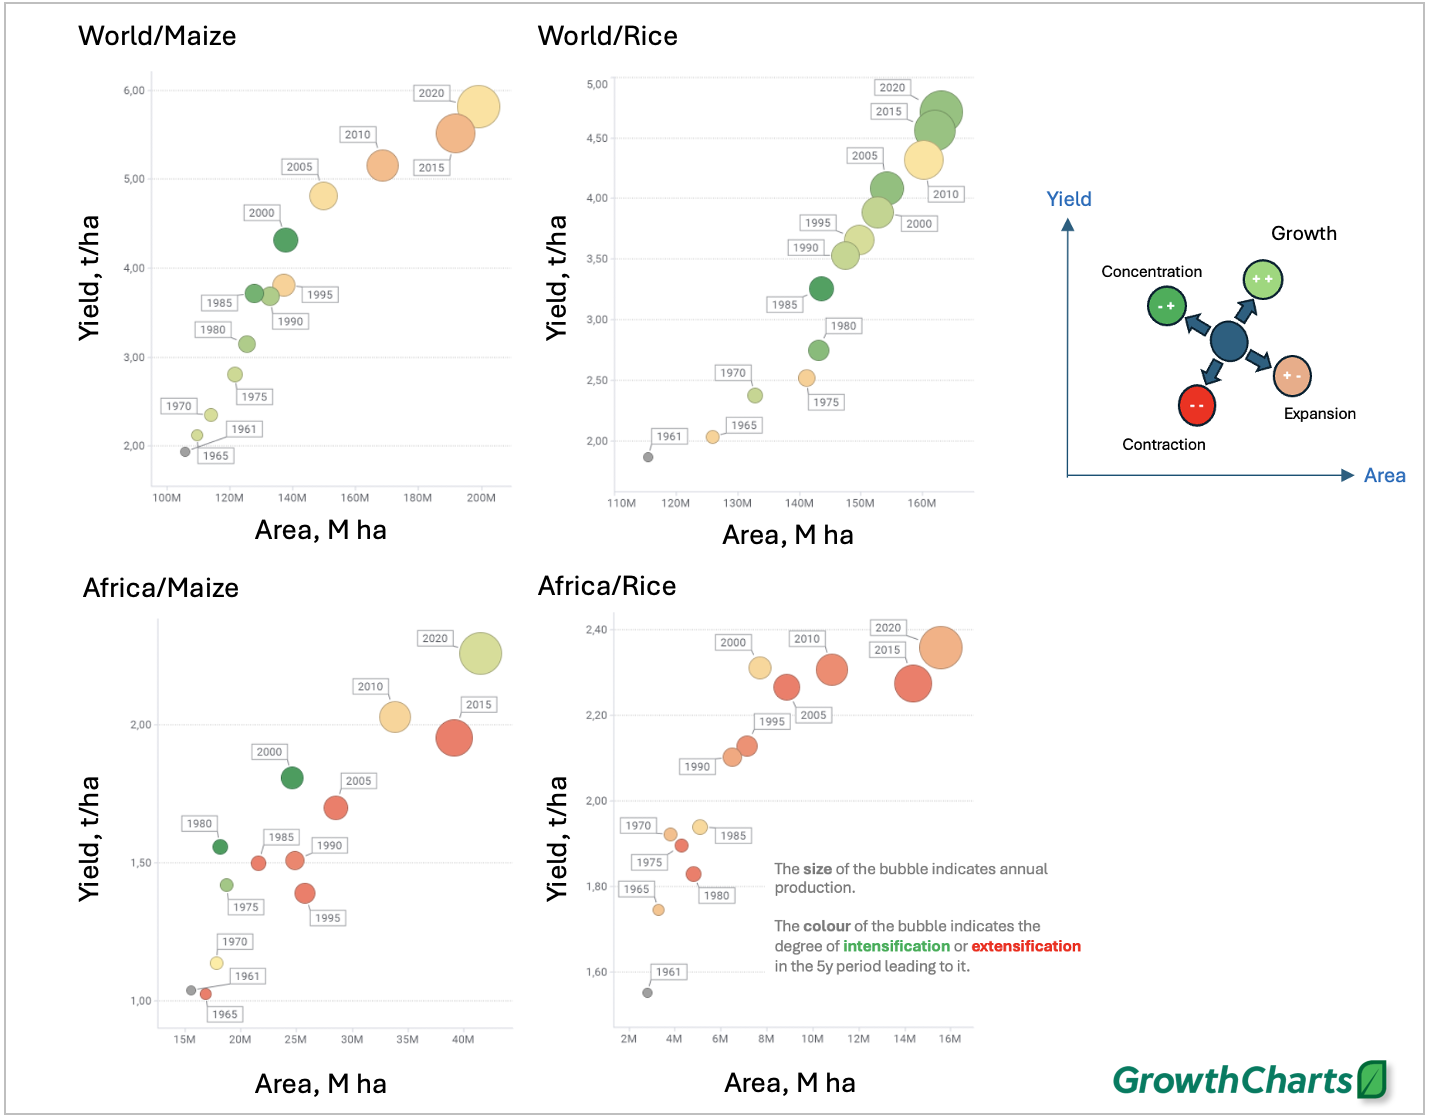
These strategies don’t occur in isolation; they often overlap and shift over time. The bubble charts for maize and rice production across the World and Africa (1961–2020) reflect how these strategies play out. Each chart plots average yield (t/ha) against average area (million ha), with bubble size showing production and color indicating recent development patterns (green = intensification, red/orange = extensification). A quadrant diagram helps place each trend in the broader conceptual framework.
In the chart above, World Maize: Early years (1961–1990) fall in the top-right quadrant (yield and area growth), shifting to the bottom-right (slower yield growth, area expansion) in 2005–2020. Africa Maize: Early years (1961–1990) are in the bottom-right quadrant (area expansion, yield stagnation), shifting toward the top-right (yield and area growth) in 2010–2020. World Rice: Most years are in the top-right quadrant, reflecting balanced intensification and moderate area growth. Africa Rice: Remains in the bottom-right quadrant (area expansion, limited yield growth) throughout. The diagram shows that intensification (green quadrants) dominates World Rice and early World Maize, while extensification (red quadrants) is prominent in Africa Rice and recent World Maize. Contraction (bottom-left) and land sparing (top-left) are not strongly evident.
Contributors: Dr. Simon Cook, Adjunct Professor, Murdoch University, Perth, Australia. Dr. Thomas Oberthür, Director of Business & Partnerships. Mr. Gavin Sulewski, Senior Editor.