
Global Maize Production: Where are we now and what can we learn?
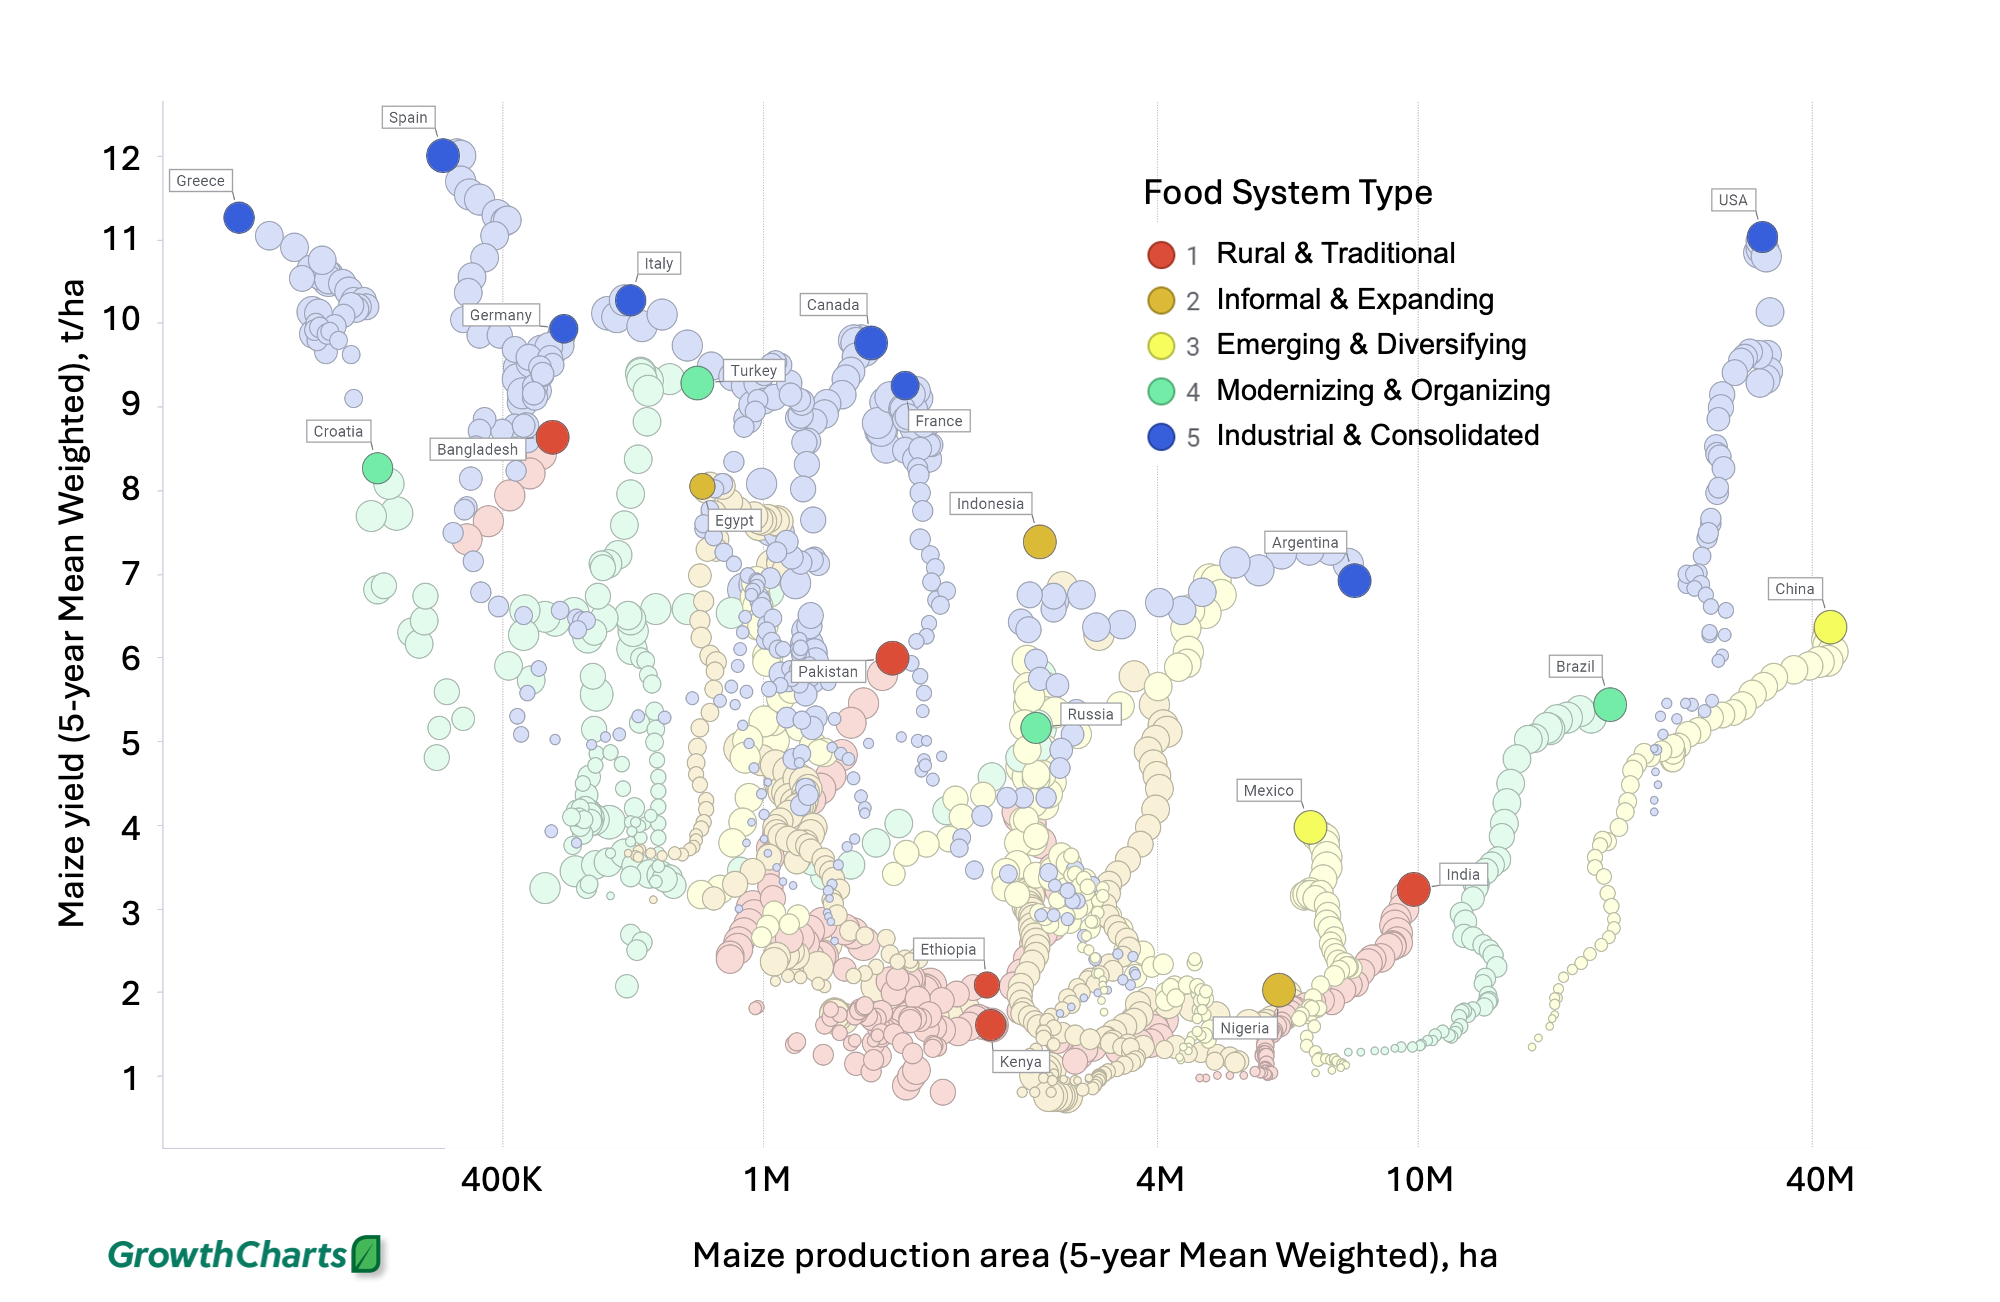
Is there a connection between national food systems and their crop intensification patterns? The chart above presents one visualization of this relationship for global maize production…a key staple food source for the world.
The chart uses five Food System (FS) categories (typologies) defined by a set of criteria (i.e., ag. value added per worker, share of dietary energy from staples, supermarkets per 100k, % urban population, etc.) outlined by Marshall et al. (2021). Our chart presents maize production since 1961 amongst 44 countries with annual productivity above 200,000 t per year. Each yield trajectory is plotted against crop area and is smoothed using 5-year mean weighted averages.
These FS divisions outline five incremental degrees of organization: 1) rural and traditional; 2) informal and expanding; 3) emerging and diversifying; 4) modernizing and organizing; and 5) industrial and consolidated. When used to categorize maize production data, they create sets of cohort countries that help us interpret the effects of complex global, continental and national dynamics that assert influence on crop development. Maize intensification has been stronger for countries with the most organized food systems. However, this relationship is not as clearcut as FS organization decreases.
Countries within the same FS typology can be responding to very different sets of external motivation and internal pressure. Collectively, these forces can swing the trajectory for crop development either towards crop intensification or extensification. Clear examples include China’s mix of large-scale extensification and yield improvement to satisfy a large internal market; Brazil’s similar but smaller scale growth responding to an attractive export market; Argentina experiencing an extended period of area expansion after earlier successes in productivity; EU and North America countries with strong intensification, or even concentration in cases where land area declines along with steadily rising productivity; Southeast Asia countries intensifying as land becomes increasing limiting; and Ethiopia and South Africawith signs of intensification where elsewhere in SSA yields remaining low and even declining.
Additionally, countries classed as having FS 1 or 2 can be especially vulnerable to protracted crises that can derail progression along growth paths of either intensification or extensification. For example, progress in Cote d’Ivoire has shown major deviations relating to civil conflict, whereas in Ghana data indicates progressive growth. Growth in Kenya has been affected by adverse climate compounded by ongoing institutional weakness. Growth in Ethiopia has been supported by strong government investment thus the effects of civil war since 2018 is less evident.
Can the patterns above help us understand how to foster success for more sustained crop intensification where food systems are not fully organized? The signals that drive on-farm decision-making are highly dependent on the consistency and reliability of government policy as well as secure supply and value chains. From an agronomic R&D perspective, ready access to strong on-farm learning networks that purposely intertwine the most relevant maize improvement strategies with farmers’ goals and resources is a key step towards building the degree of resilience needed to enable shifts towards greater productivity per cropped area.
Reference
Marshall, Q. et al., 2021. Building a Global Food Systems Typology: A New Tool for Reducing Complexity in Food Systems Analysis, Frontiers in Sustainable Food Systems 5. DOI: 10.3389/fsufs.2021.746512
Contributors: Dr. Simon Cook, Adjunct Professor, Murdoch University, Perth, Australia. Dr. Thomas Oberthür, Director of Business & Partnerships. Mr. Gavin Sulewski, Senior Editor.