
Planting Heat Map: When are most of Kenya’s farmers experiencing critically dry spells.
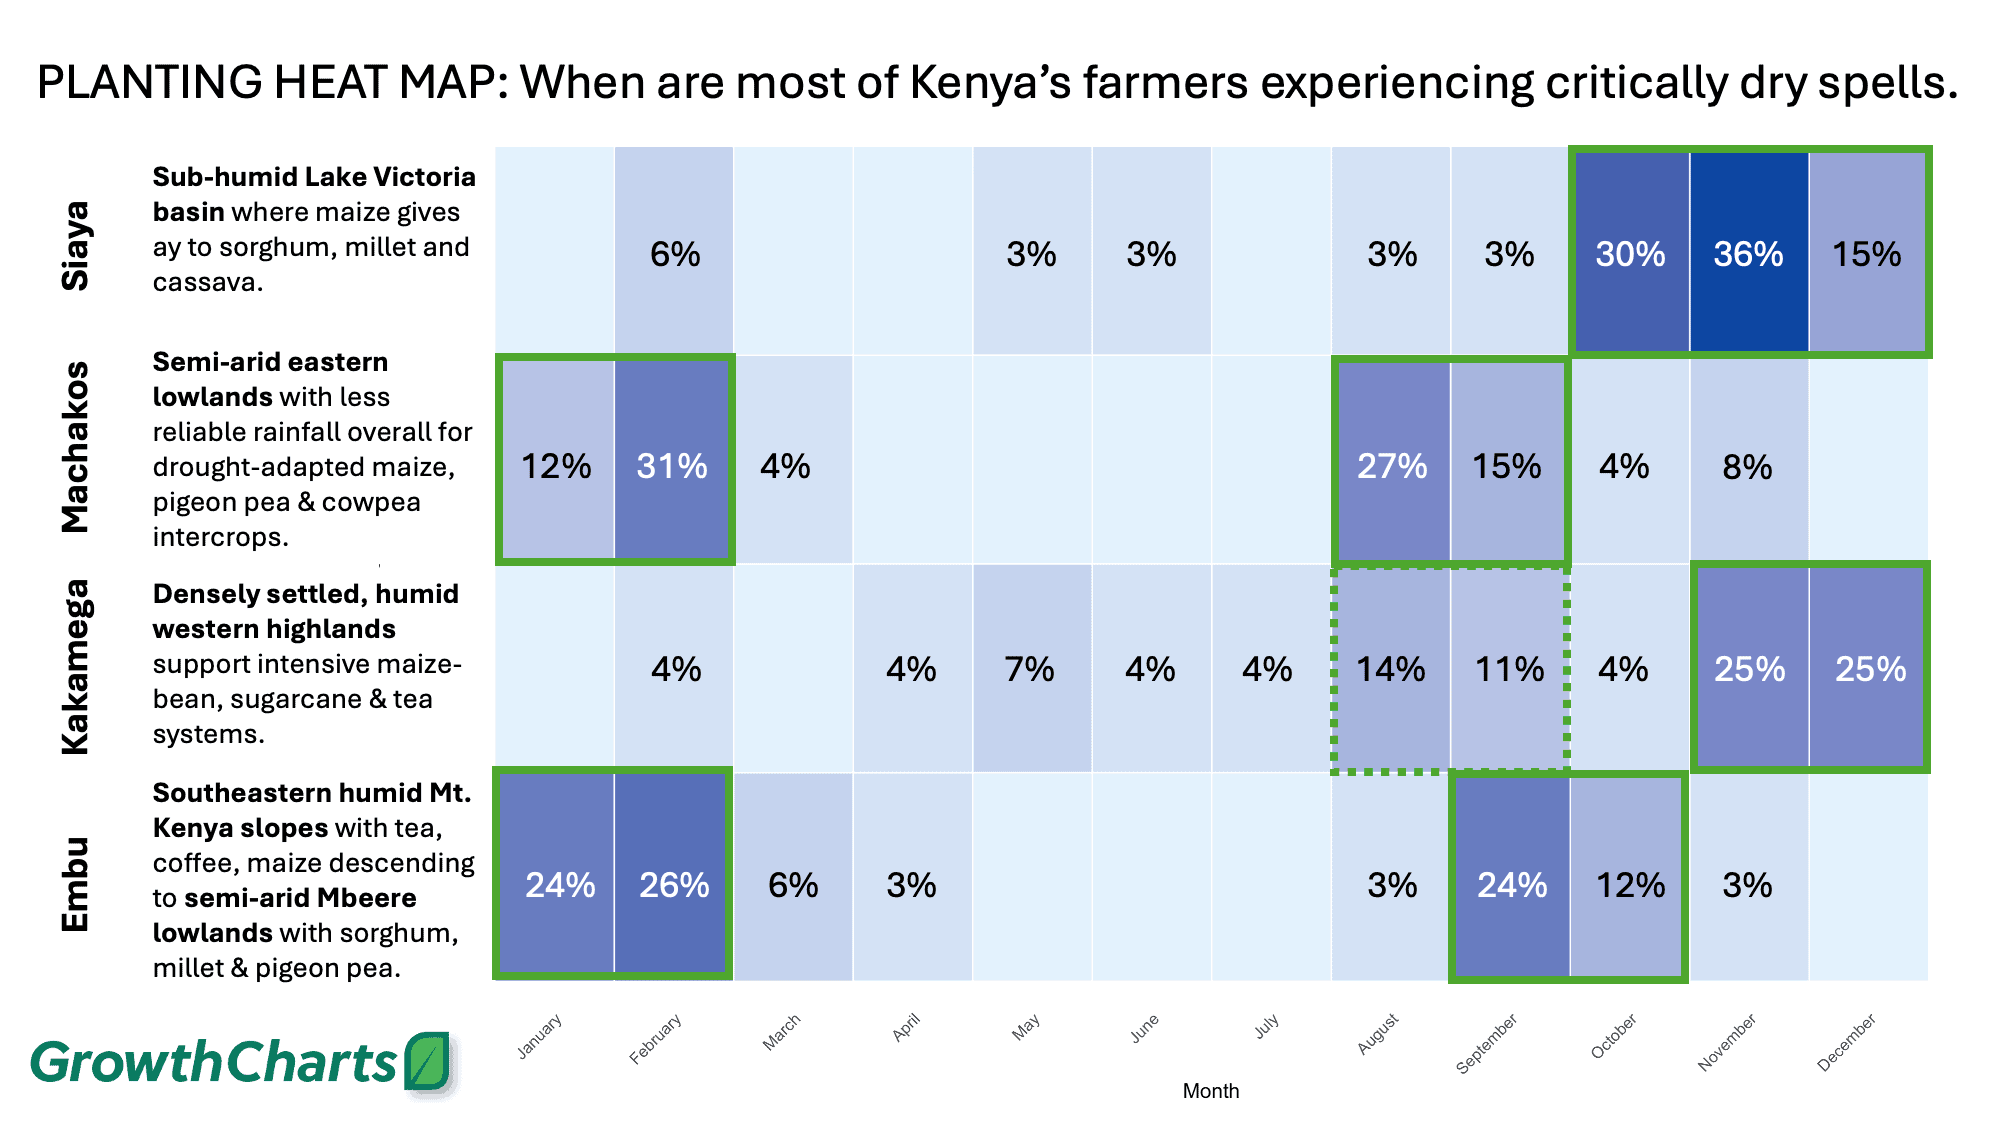
Values (%) represent the proportion of farmers experiencing extended drought across the year. Darker shades indicate months with higher likelihood for poor planting conditions.
Exploratory work with farmers across Kenya is helping to establish a baseline understanding on farmer experiences with weather variability. One goal of this work is a reimagining of how farmer-responsive information systems can be built to enable more effective site-specific fertilizer management.
Optimizing the timing of a nutrient application requires an alignment of field-level practices with the macro-climatic signals dictating regional seasonal patterns. Equally important is timely access to monies needed to finance access to the right fertilizer when it is needed most. These discussions with famers are gathering a range of field-scale experiences to better understand their climatic- and financial-related risks. Farmer experiences depicted in the regional heat map above, and described below, informs subsequent work aimed at bridging existing information gaps and transitioning towards a capacity for on-farm nutrient applications that are more synchronized with environmental signals, and more transparent to financial providers.
In Siaya County, farmers are experiencing a modified bimodal rainfall pattern heavily influenced by the Lake Victoria basin, which creates unique local convection and keeps the region relatively humid through the middle of the year. This explains why the heatmap shows virtually zero dry spells from March all the way through September. Instead, the major agricultural risk in Siaya occurs at the end of the year, when most critical events are reported (30% in October, 36% in November, and 15% in December). This highlights a critical vulnerability to late-year dry spells during what is traditionally expected to be a reliable rainy period.
Farmers in Machakos County have a classic eastern Kenyan bimodal precipitation pattern, characterized by distinct “Long Rains” (March–May/mid-June) and “Short Rains” (October–December), separated by harsh dry seasons. The heatmap perfectly mirrors this climate rhythm, showing severe clusters of farmer-reported dry spells during the traditional dry gaps. Specifically, 31% of critical events occur in February, immediately before the long rains, with a comparable peak (27%) in August during the cool dry season. During the actual rainy seasons, reported dry spells drop to near zero, which is evidence that the seasonal rains are generally arriving as expected.
Kakamega County farmers are experiencing a high-rainfall, quasi-monomodal to heavily modified bimodal system supported by the nearby Kakamega Forest and lake breezes, providing robust moisture for most of the year. Because of this continuous rainfall support, farmers report very few dry spells from January through October, with only minor dry-spell activity (11%–14%) appearing in the August–September transition. However, much like Siaya, Kakamega’s primary vulnerability is exposed at the end of the year. Then, farmers experience an abrupt surge in dry events during November (25%) and December (25%), pointing to a distinct end-of-year moisture deficit.
In Embu County, sitting on the windward slopes of Mount Kenya, farmers have pronounced and highly reliable bimodal rainfall regime driven by the Intertropical Convergence Zone. The heatmap demonstrates that the mountain-fed “Long Rains” of March and April are incredibly dependable, with almost no dry spells reported. However, the county faces intense dry windows immediately surrounding these seasons; a combined 50% of all dry events are squeezed into January and February, while another major 24% spike occurs in September just before the short rains are due to break.
Climate-smart decision support tools that can translate these derisked but regionally fluctuating climatic windows into actionable signals for farmers are highly needed to improve the effectiveness of nutrient applications.
Author: Mr. Brayan Valencia (e-mail: b.valencia@apni.net) GIS Analyst and Hydrologist based in Benguérir, Morocco.